
MLSuite 2026 Now Available!
AI-Assisted Reporting, Richer Scenes, and Support for Two New Instrument Types
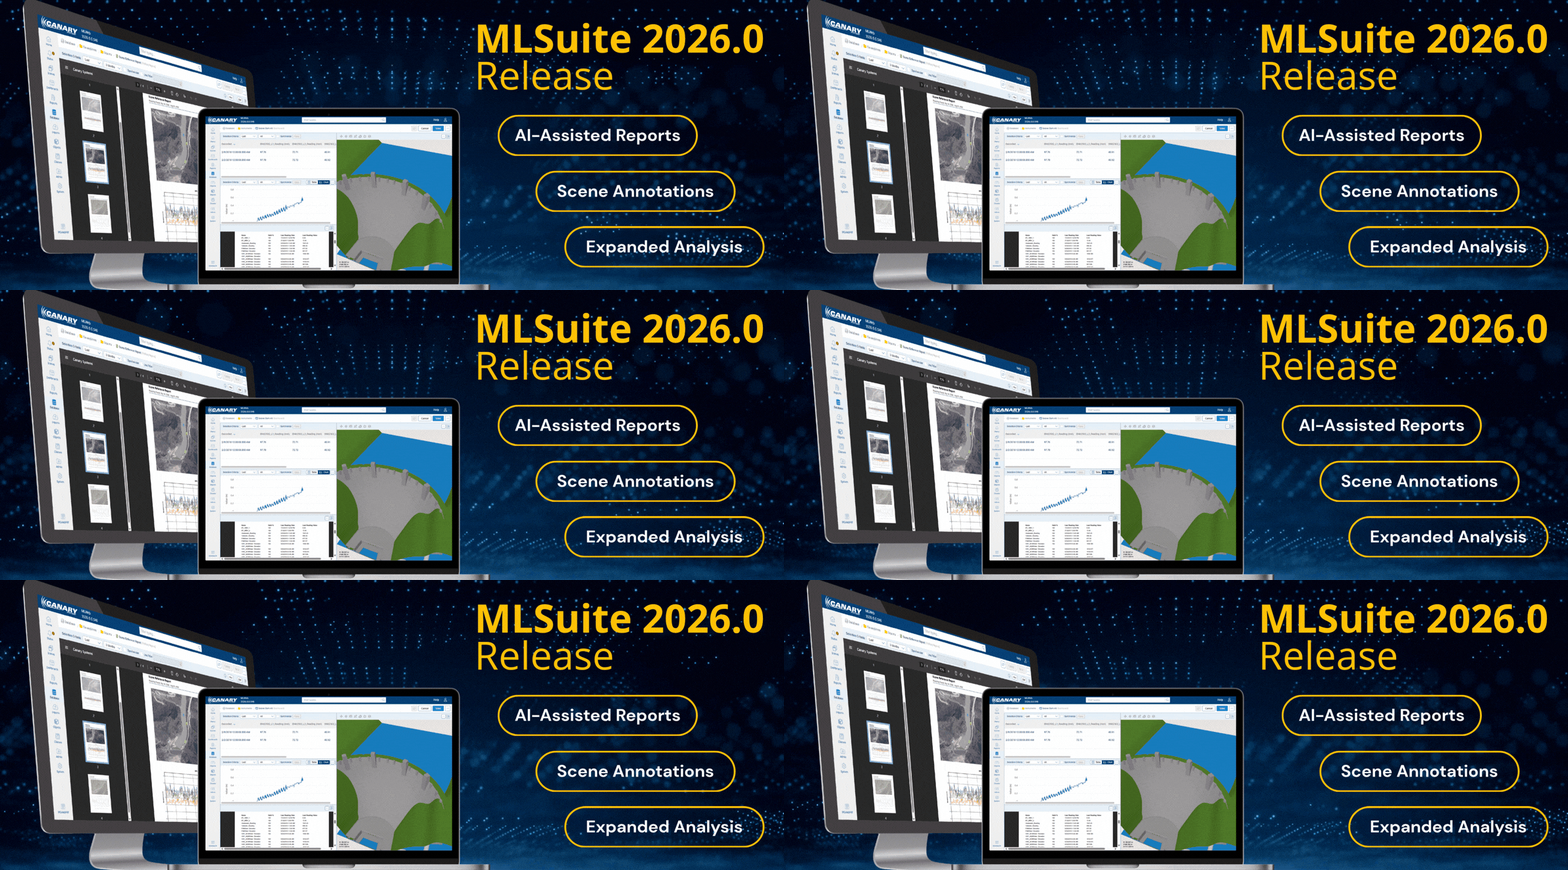
The 2026 release of MLSuite introduces an all-new reporting engine with AI agent-assisted custom reports. This release also brings collaborative annotations into your Scenes, adds native support for digital fiber optic sensors and in-place inclinometers, and delivers a number of analysis, charting, and hardware improvements that streamline day-to-day monitoring and improve risk management capabilities.
AI-Assisted Python Reports
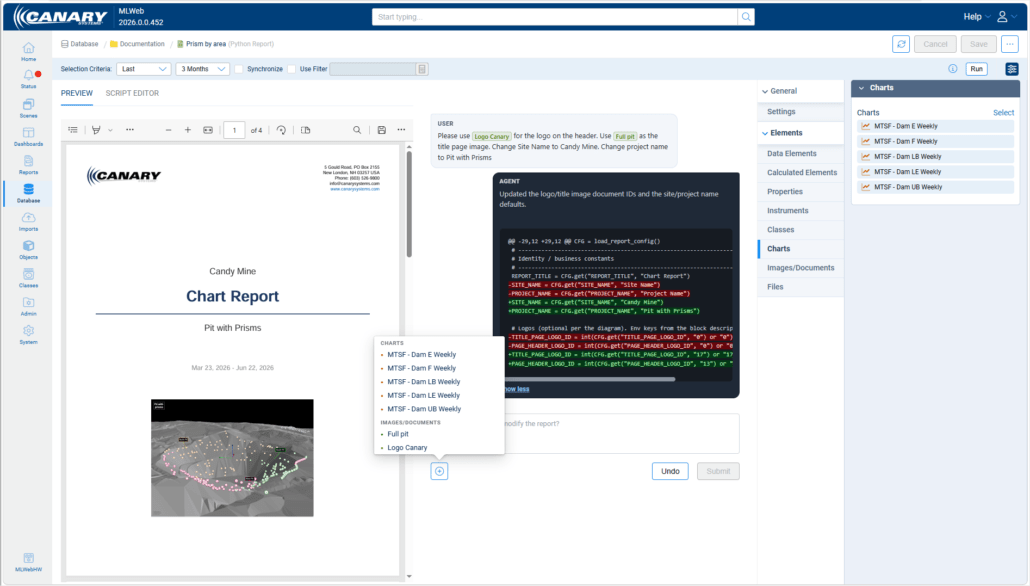
The biggest addition in this release is a completely new reporting engine built on Python and driven by a conversational AI Agent.
Users can start from a template or a blank report, then describe to the AI agent what is needed in plain language. Simple to complex edits can be made through the agent such as:
- changing the title
- adding a company logo
- placing charts side-by-side or stacked
- building a summary table from data
For anyone who’s ever wanted a specific report layout but didn’t have the scripting background to build it, this makes the engine more accessible than ever. For users who are comfortable with Python, the underlying script stays fully accessible for manual editing and finer control.
Report creation and AI Agent access are available to Database Manager and Administrator level users of MLSuite. Other users may view and run reports with provided permissions.
Consistent Report Templates
The Python reports feature in MLSuite includes a library of preconfigured templates and the ability to create new templates for your organization. Once your preferred layout, branding, and formatting are captured in a template, every new report starts from the same base creating a consistent look without the need for manual formatting.
There are currently four templates that come included:
- Chart Report – Select existing database charts and generate a report around them. Default layout is two charts per page, with ability to rearrange via AI agent prompting.
- Instrument Status Report – A grouped summary for one or more classes showing last valid reading, reading date, total readings, and days since last reading with a closing summary highlighting inactive instruments and data collection gaps.
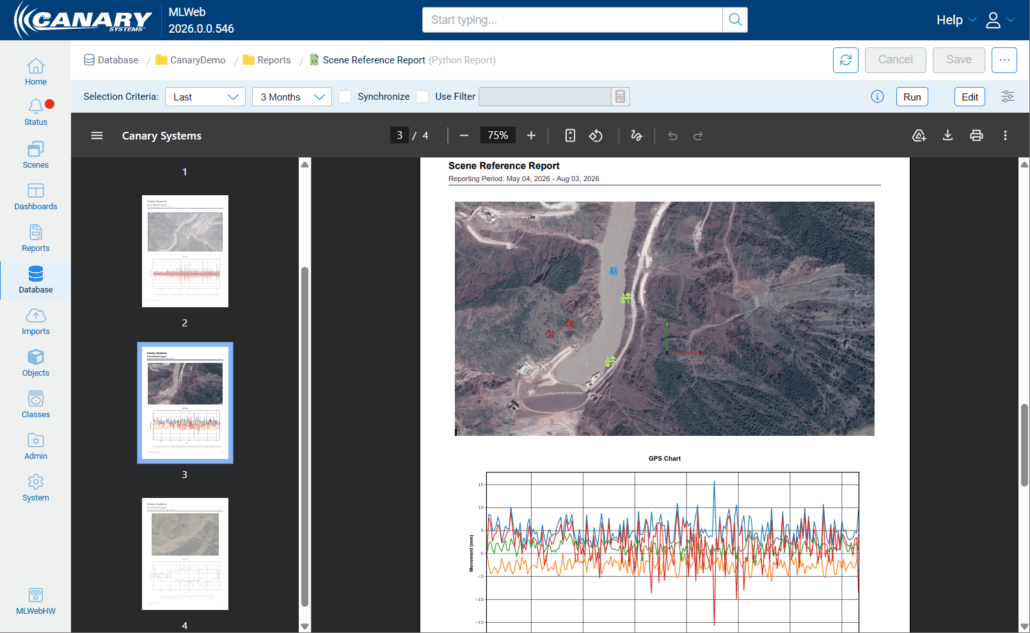
- Scene Reference Report – Pairs Scene images with their related monitoring charts, so a single document shows both where an instrument sits and what it’s telling you. This chart type is ideal for inspections and stakeholder communication.
- Server Status Report – Pulls server configuration, software versions, and storage details straight from the Server Status API. Useful for validation, troubleshooting, and documenting a deployment.
Background Report Generation
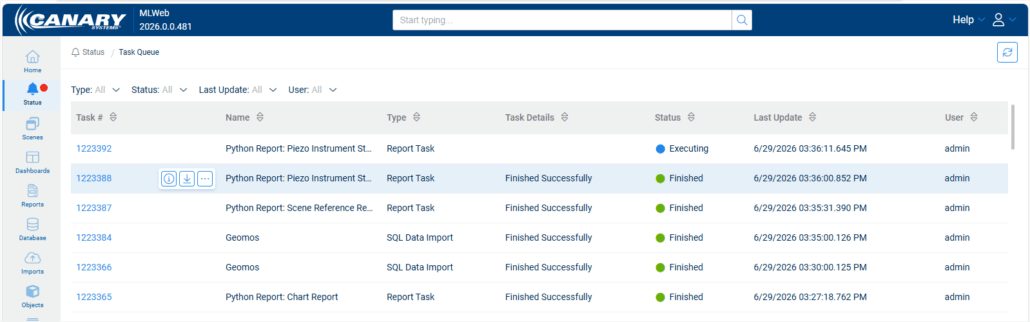
Custom Reports and Python Reports can now be submitted to the Task Queue. Rather than watching a progress bar, you send the report off and keep working elsewhere in the application while it processes. The Task Queue shows whether it’s queued, running, or complete, and you open the finished report when it’s ready.
If you’ve ever waited on a large Custom Report, you’ll feel this one immediately.
Scene Annotations
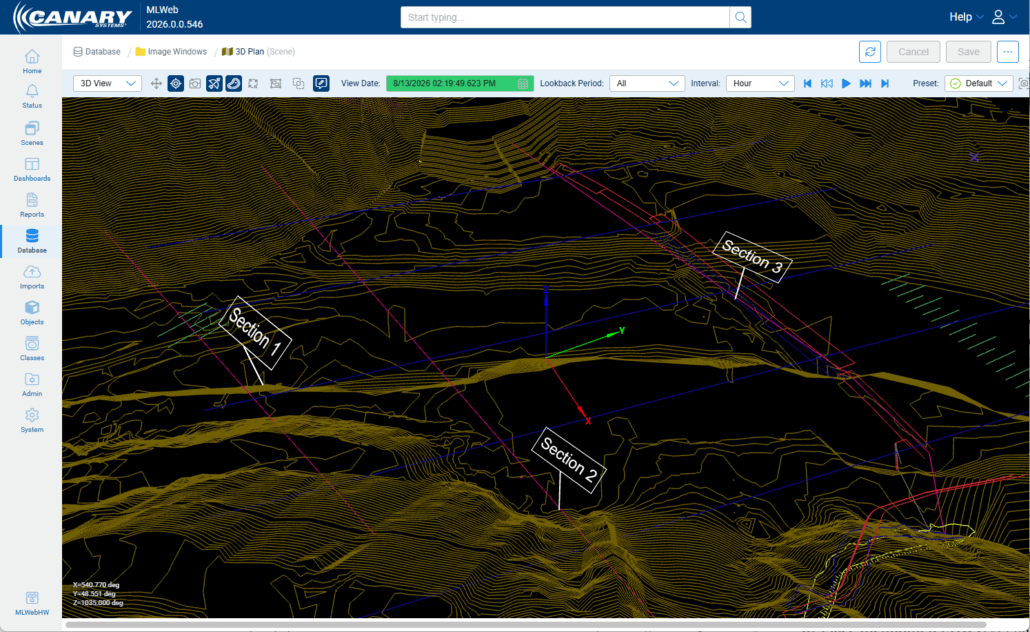
Scenes are where monitoring data becomes visual. With the release of MLSuite 2026, they become collaborative too.
Scene Annotations let you place formatted text, including clickable hyperlinks, directly into a Scene. Users can anchor an annotation to a specific object so it travels with what it describes, or place it in the overall view. Because annotations save with the Scene preset, everyone who opens that preset sees them.
Use them to flag an area of interest, document an inspection finding, leave instructions for the next person on site, or link out to supporting documentation. Toggle them on and off from the Scene toolbar, and manage the full set from the new Annotations tab in the Content panel.
New Instrument Integrations
Digital Fiber Optic Sensors (DFOS) are now supported end-to-end. Import DFOS data, analyze it with a new DFOS function that works just like the existing TDR functions: absolute or relative calculations, baseline selection, distance ranges, multiple output types. Visualize the results with Absolute, Relative, and a brand new Heatmap chart that shows change along the fiber over time.
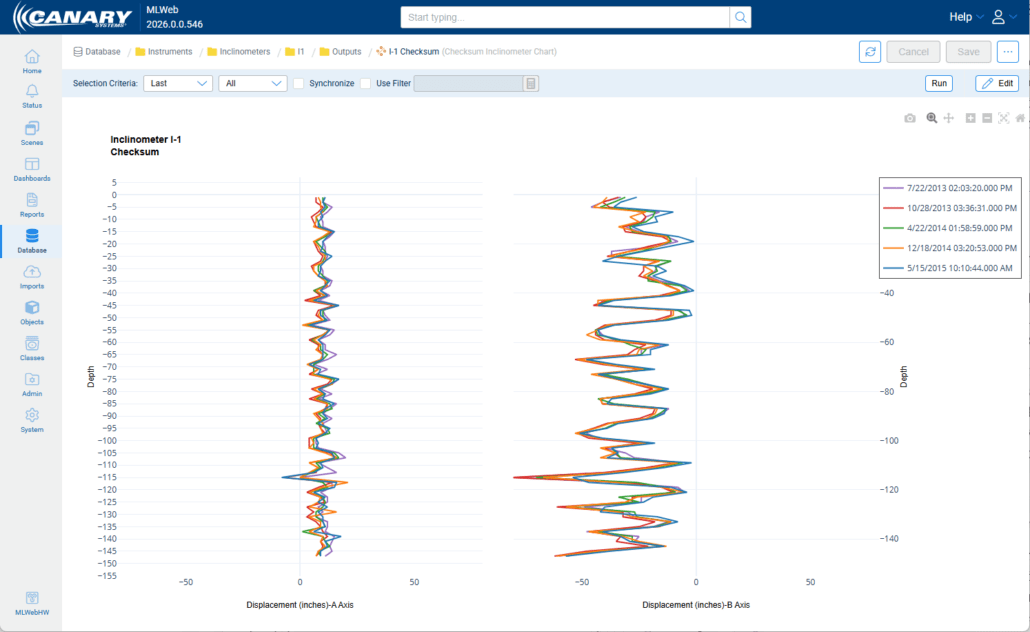
In-Place Inclinometers (IPI) now have native support in MLSuite with the 2026 release. Previously, working with IPI data usually meant custom scripting to get measurements into the system. Now import, analysis, charting, and reporting all work out of the box, using the same inclinometer functions and chart types you’re already familiar with.
Expanded Analysis and Charting Capability
Significant updates to analysis and charting capabilities include:
- Multiple inclinometer baselines – When a casing is replaced or an installation changes, a new baseline should be established. Our charts can display both periods with earlier surveys referencing the original baseline, while newer ones use the new baseline.
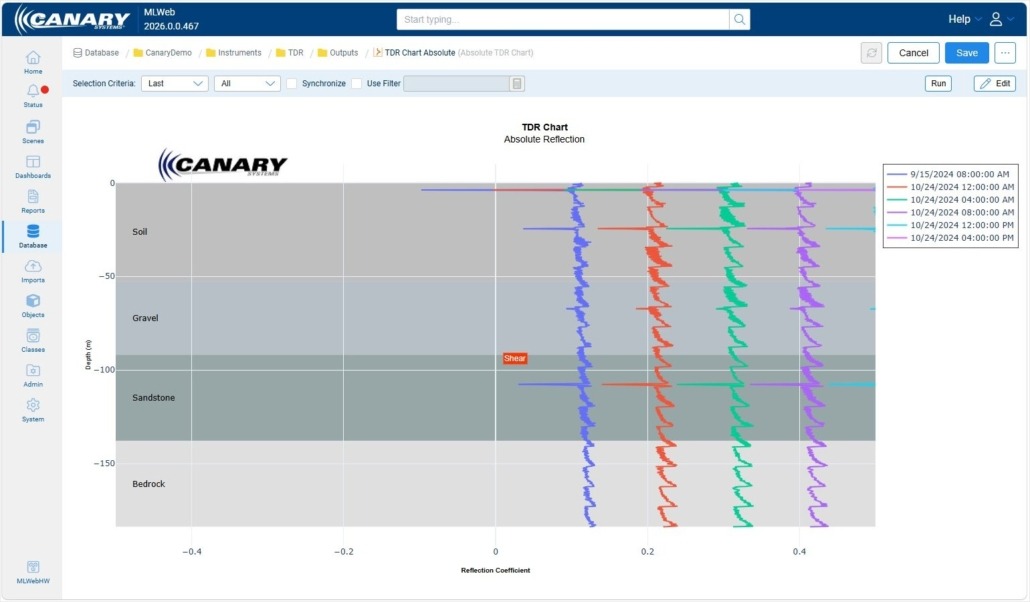
- Bands as an instrument property – Define labels, colors, and depth ranges per instrument, then configure one TDR or inclinometer chart in Class Design and apply it across the class. Each instrument displays its own stratigraphy automatically.
- Time-based survey selection – Instead of only “last X readings,” choose an interval—one week, one month, or one year—and the system returns the survey closest to that point in time.
- Extend to Current Date – Charts now run to the current date, even when readings have stopped.
- Property-driven Start and End Levels – For TDR and inclinometer functions, enabling multiple analysis zones per instrument that can be reused through Class Design.
- Per-point Scene Chart Traces – Plot each selected point individually rather than only aggregates, to compare how locations within an area behave over time.
MLField App Upgrade
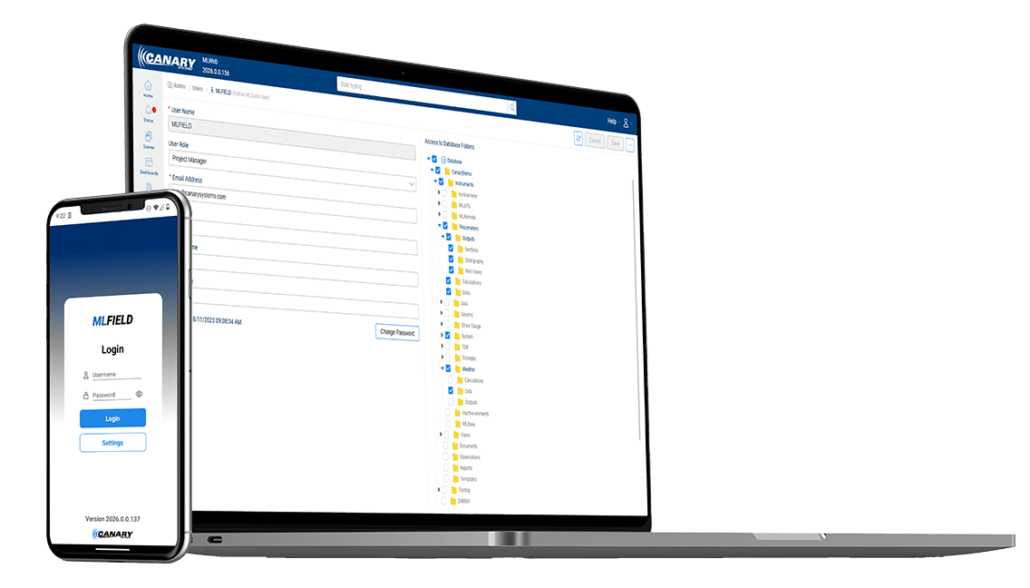
MLField has been significantly redesigned as part of this release. A course is available on Canary University with an overview of improved features. This course covers setup and navigation plus core tasks like locating instruments, scanning QR codes, entering readings (with optional photo/note), and working offline with later MLWeb synchronization.
For organizations using third-party mobile application management solutions, deployment has been simplified. Additionally, incremental build numbers now simplify deployment through third-party mobile device management platforms.
Additional Updates
- MLSuite
- MLSuite installer has been updated to allow for more flexibility when deploying a multi-server set up. MLWeb, MLWebHardware and MLAdmin can now be installed on separate machines.
- Database backups can be performed through MLAdmin or scheduled through MLWeb
- MLWeb
- Dashboards now support documents, including HTML
- Objects, Imports, and Tasks can be organized with Categories
- Add descriptions to Charts, Reports, and Scenes
- Data Update and Folder Update notifications now show when data resumes
- Improved security with web session management and REST API keys can be configured to expire after a defined interval
- MLWebHardware
- New Global Search function
- Event Recorders were added
- Improved storage diagnostics
- Latest firmware available for MLGPS, MLRemote, and MLBase
Notes & Reminders
- Our API documentation is hosted within the MLSuite application. The API can be accessed from the Help Menu from within MLWeb or at[serverdomain]/content/docs/rest-api.html.
- All supplemental documentation for this MLSuite release and other software and hardware products can be found under the Resources of Canary University.
If you need any assistance with upgrading to the latest version, or have any other questions about MLSuite, please reach out to our support team.
Support & Training
MLSuite 2026 is available now. Dedicated courses covering AI-Assisted Python Reports, Scene Annotations, and the rest of the release are available through Canary University. Our support team is ready to help with upgrade planning so contact us today about your options!


